
Market Highlight – SGX Iron Ore
Iron ore stands as the fundamental raw material in the manufacturing of steel, a versatile alloy crucial to diverse industries. Steel manifests in various forms such as rebar, plates, and hot-rolled coils, playing an integral role in construction, shipbuilding, and various manufacturing endeavors.
At the forefront of global iron ore consumption is China, serving as the principal importing nation for seaborne iron ore. Notably, key contributors to the global iron ore supply chain are countries like Australia and Brazil, recognized as major iron ore producers. This symbiotic relationship between iron ore production, global trade, and steel manufacturing underscores the pivotal role that iron ore plays in shaping international industries and infrastructure development.
In 2018, iron ore started trading on the Singapore Commodity Exchange, emerging as a robust and consistently trending market since its inclusion. The market’s appeal has grown steadily, evident in the increasing open interest and trading volume. This positive trajectory positions iron ore as a valuable addition to a trend-following systems trading portfolio.
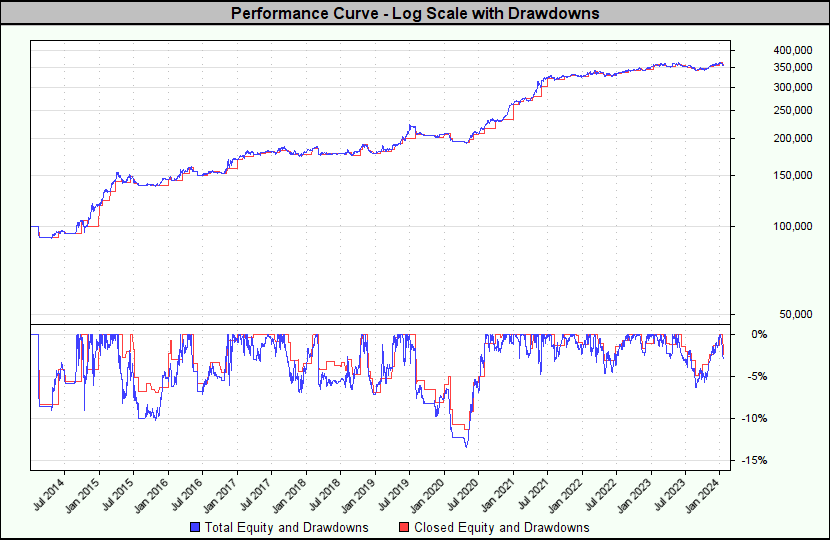
Here we feature one of our Iron Ore breakout trading systems traded with a fixed fractional money management strategy at 2% risk per trade. For those seeking a comprehensive report or additional insights into how Iron Ore performs in conjunction with other markets exhibiting low correlation, please get in touch.
Iron Ore Summary Results |
| Test | Ending Balance | Ending VADI | CAGR% | MAR | Modified Sharpe | Annual Sharpe | Max Total Equity DD | Longest Drawdown | # Trades | |
| 1 | 354,448.14 | 354,448.14 | 13.43% | 1.00 | 1.15 | 1.35 | 13.4% | 13.1 | 34 | |
| Year | Days | Closed Balance | End Total Equity | End VADI | Total Equity Gain | Gain % | # Trades |
| 2014 | 365 | 117,748.52 | 117,748.52 | 117,748.52 | 17,748.52 | 17.7% | 2 |
| 2015 | 365 | 144,620.75 | 144,620.75 | 144,620.75 | 26,872.23 | 22.8% | 4 |
| 2016 | 366 | 169,903.41 | 169,903.41 | 169,903.41 | 25,282.65 | 17.5% | 4 |
| 2017 | 365 | 176,194.59 | 179,642.59 | 179,642.59 | 9,739.18 | 5.7% | 5 |
| 2018 | 365 | 177,497.38 | 177,497.38 | 177,497.38 | -2,145.20 | -1.2% | 5 |
| 2019 | 365 | 205,894.11 | 205,894.11 | 205,894.11 | 28,396.73 | 16.0% | 3 |
| 2020 | 366 | 260,644.65 | 260,644.65 | 260,644.65 | 54,750.54 | 26.6% | 2 |
| 2021 | 365 | 325,381.54 | 325,381.54 | 325,381.54 | 64,736.89 | 24.8% | 2 |
| 2022 | 365 | 343,298.72 | 352,448.72 | 352,448.72 | 27,067.18 | 8.3% | 2 |
| 2023 | 365 | 363,028.14 | 362,392.14 | 362,392.14 | 9,943.42 | 2.8% | 4 |
| 2024 | 17 | 354,448.14 | 354,448.14 | 354,448.14 | -7,944.00 | -2.2% | 1 |
![]()
| Symbol | Wins | % | Losses | % | Trades | Win Months | % | Loss Months | % | Avg. Win % | Avg. Loss % | Avg. Trade % | % Profit Factor |
| SEF | 18 | 52.9% | 16 | 47.1% | 34 | 81 | 66.9% | 40 | 33.1% | 10.24% | 1.93% | 4.51% | 5.98 |
| Test Period for parameter run 1. | ||
| First Test Date | 2014-01-01 | |
| Last Test Date | 2024-01-17 | |
|
|
||||||||||||||||||||||||||||||||||||||||||||||||||||||||||||||||||||||||||||||||||||||||||||||||||||||||||||||||||||||||||||||||||||||||||||||||||||||||||||||||||||||||||||||||||||||||||||||||||||||||||||||||||||||||||||||||||||||||||||||||||||||||||||||||||||||||||||||||||||||||||||||||||||||||||||||||||||||||||||||||||||||||||||||||||||||||||||||||||||||||||||||
Required Disclaimer – Commodity Futures Trading Commission: Futures and options trading has large potential rewards, but also large potential risk. You must be aware of the risks and be willing to accept them in order to invest in the futures and options markets. Don’t trade with money you can’t afford to lose. This website is neither a solicitation nor an offer to Buy/Sell futures or options. No representation is being made that any account will or is likely to achieve profits or losses similar to those discussed on this website. The past performance of any trading system or methodology is not necessarily indicative of future results
CFTC RULE 4.41 – HYPOTHETICAL OR SIMULATED PERFORMANCE RESULTS HAVE CERTAIN LIMITATIONS. UNLIKE AN ACTUAL PERFORMANCE RECORD, SIMULATED RESULTS DO NOT REPRESENT ACTUAL TRADING. ALSO, SINCE THE TRADES HAVE NOT BEEN EXECUTED, THE RESULTS MAY HAVE UNDER-OR-OVER COMPENSATED FOR THE IMPACT, IF ANY, OF CERTAIN MARKET FACTORS, SUCH AS LACK OF LIQUIDITY, SIMULATED TRADING PROGRAMS IN GENERAL ARE ALSO SUBJECT TO THE FACT THAT THEY ARE DESIGNED WITH THE BENEFIT OF HINDSIGHT. NO REPRESENTATION IS BEING MADE THAT ANY ACCOUNT WILL OR IS LIKELY TO ACHIEVE PROFIT OR LOSSES SIMILAR TO THOSE SHOWN.