
Our Diversified Strategy stands out as our top recommendation for portfolios with a starting value of $250,000 or more. This sophisticated approach involves trading 42 global futures markets, employing a powerful combination of trend following and an equity rebalancing strategy. What sets this strategy is apart is its remarkably low correlation, creating a portfolio that not only exhibits a consistently smooth equity curve but also offers diversification with minimal correlation to traditional assets such as stocks and bonds. This unique blend of strategies has demonstrated its ability to navigate various market conditions effectively, making it an excellent choice for investors seeking stability and diversification in their portfolios.
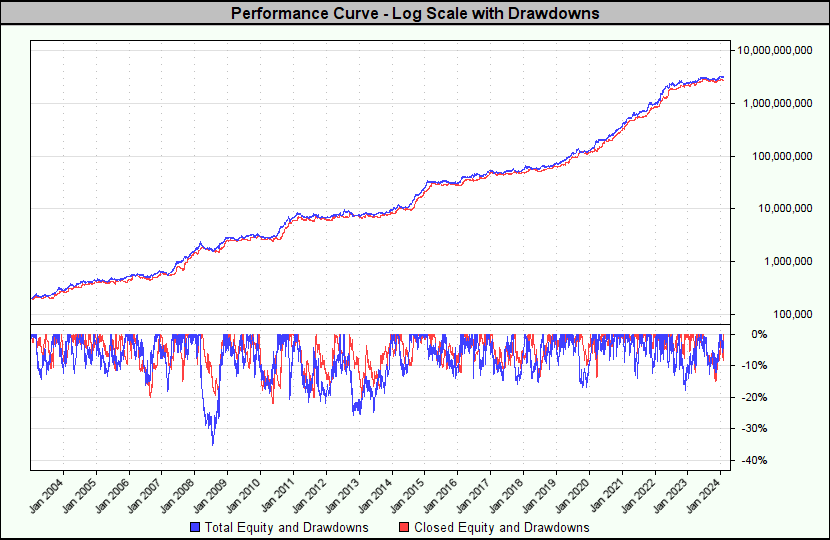
| Test | Ending Balance | Ending VADI | CAGR% | MAR | Modified Sharpe | Annual Sharpe | Max Total Equity DD | Longest Drawdown | # Trades | |
| 1 | 3,192,388,725.32 | 3,192,388,725.32 | 58.28% | 1.65 | 1.67 | 0.95 | 35.2% | 17.2 | 4,521 | |
| Year | Days | Closed Balance | End Total Equity | End VADI | Total Equity Gain | Gain % | # Trades |
| 2003 | 365 | 269,198.08 | 285,230.15 | 285,230.15 | 85,230.15 | 42.6% | 153 |
| 2004 | 366 | 412,277.40 | 439,211.81 | 439,211.81 | 153,981.66 | 54.0% | 189 |
| 2005 | 365 | 463,057.20 | 534,905.57 | 534,905.57 | 95,693.76 | 21.8% | 175 |
| 2006 | 365 | 611,295.02 | 639,395.37 | 639,395.37 | 104,489.80 | 19.5% | 196 |
| 2007 | 365 | 1,467,461.57 | 1,563,958.20 | 1,563,958.20 | 924,562.83 | 144.6% | 173 |
| 2008 | 366 | 2,500,130.43 | 2,879,078.90 | 2,879,078.90 | 1,315,120.71 | 84.1% | 199 |
| 2009 | 365 | 2,837,232.68 | 2,986,434.04 | 2,986,434.04 | 107,355.14 | 3.7% | 230 |
| 2010 | 365 | 6,119,440.86 | 6,901,217.97 | 6,901,217.97 | 3,914,783.93 | 131.1% | 216 |
| 2011 | 365 | 6,277,573.39 | 6,871,377.63 | 6,871,377.63 | -29,840.34 | -0.4% | 259 |
| 2012 | 366 | 7,215,926.95 | 7,514,460.05 | 7,514,460.05 | 643,082.41 | 9.4% | 256 |
| 2013 | 365 | 8,731,819.88 | 9,654,509.46 | 9,654,509.46 | 2,140,049.41 | 28.5% | 219 |
| 2014 | 365 | 21,478,958.72 | 25,184,177.95 | 25,184,177.95 | 15,529,668.49 | 160.9% | 196 |
| 2015 | 365 | 28,780,134.90 | 30,907,071.42 | 30,907,071.42 | 5,722,893.47 | 22.7% | 246 |
| 2016 | 366 | 48,162,763.69 | 50,821,241.21 | 50,821,241.21 | 19,914,169.79 | 64.4% | 237 |
| 2017 | 365 | 48,454,530.57 | 55,967,084.01 | 55,967,084.01 | 5,145,842.81 | 10.1% | 248 |
| 2018 | 365 | 63,578,451.78 | 73,447,527.72 | 73,447,527.72 | 17,480,443.70 | 31.2% | 226 |
| 2019 | 365 | 117,105,336.03 | 126,237,873.16 | 126,237,873.16 | 52,790,345.44 | 71.9% | 212 |
| 2020 | 366 | 326,033,731.97 | 380,925,692.39 | 380,925,692.39 | 254,687,819.23 | 201.8% | 198 |
| 2021 | 365 | 855,279,074.91 | 956,496,041.30 | 956,496,041.30 | 575,570,348.91 | 151.1% | 189 |
| 2022 | 365 | 2,192,904,372.24 | 2,464,847,392.33 | 2,464,847,392.33 | 1,508,351,351.02 | 157.7% | 227 |
| 2023 | 365 | 2,869,064,253.03 | 3,220,749,589.60 | 3,220,749,589.60 | 755,902,197.27 | 30.7% | 257 |
| 2024 | 29 | 2,654,214,160.62 | 3,192,388,725.32 | 3,192,388,725.32 | -28,360,864.27 | -0.9% | 20 |
![]()
| Symbol | Wins | % | Losses | % | Trades | Win Months | % | Loss Months | % | Avg. Win % | Avg. Loss % | Avg. Trade % | % Profit Factor |
| BAX | 59 | 28.6% | 147 | 71.4% | 206 | 103 | 40.7% | 150 | 59.3% | 1.45% | 0.63% | -0.03% | 0.92 |
| BL2 | 57 | 44.5% | 71 | 55.5% | 128 | 141 | 55.7% | 112 | 44.3% | 2.68% | 0.79% | 0.75% | 2.71 |
| BO2 | 38 | 40.9% | 55 | 59.1% | 93 | 141 | 55.7% | 112 | 44.3% | 1.86% | 0.72% | 0.34% | 1.79 |
| CGB | 35 | 41.2% | 50 | 58.8% | 85 | 149 | 58.9% | 104 | 41.1% | 1.51% | 0.67% | 0.23% | 1.58 |
| COX | 25 | 36.8% | 43 | 63.2% | 68 | 142 | 56.1% | 111 | 43.9% | 4.31% | 0.84% | 1.05% | 2.97 |
| CT2 | 29 | 35.8% | 52 | 64.2% | 81 | 130 | 51.4% | 123 | 48.6% | 2.78% | 0.86% | 0.45% | 1.81 |
| DA | 28 | 41.2% | 40 | 58.8% | 68 | 155 | 61.3% | 98 | 38.7% | 3.22% | 0.76% | 0.88% | 2.96 |
| DA2 | 78 | 44.6% | 97 | 55.4% | 175 | 143 | 56.5% | 110 | 43.5% | 1.80% | 0.54% | 0.50% | 2.68 |
| DX | 26 | 44.8% | 32 | 55.2% | 58 | 162 | 64.0% | 91 | 36.0% | 2.11% | 0.80% | 0.50% | 2.14 |
| EBL | 66 | 41.8% | 92 | 58.2% | 158 | 133 | 52.6% | 120 | 47.4% | 0.85% | 0.49% | 0.07% | 1.25 |
| EBM | 78 | 46.7% | 89 | 53.3% | 167 | 123 | 48.6% | 130 | 51.4% | 0.77% | 0.51% | 0.08% | 1.30 |
| EMA | 44 | 51.2% | 42 | 48.8% | 86 | 154 | 60.9% | 99 | 39.1% | 3.09% | 0.99% | 1.10% | 3.27 |
| FEI | 16 | 40.0% | 24 | 60.0% | 40 | 166 | 65.6% | 87 | 34.4% | 3.69% | 0.89% | 0.94% | 2.76 |
| FLG | 33 | 38.8% | 52 | 61.2% | 85 | 152 | 60.1% | 101 | 39.9% | 1.48% | 0.55% | 0.24% | 1.70 |
| FV | 12 | 30.0% | 28 | 70.0% | 40 | 143 | 56.5% | 110 | 43.5% | 4.10% | 0.90% | 0.60% | 1.96 |
| JT | 18 | 36.7% | 31 | 63.3% | 49 | 145 | 57.3% | 108 | 42.7% | 3.47% | 0.83% | 0.75% | 2.42 |
| KPO | 50 | 42.4% | 68 | 57.6% | 118 | 126 | 49.8% | 127 | 50.2% | 1.83% | 0.68% | 0.38% | 1.98 |
| LCO | 80 | 45.2% | 97 | 54.8% | 177 | 145 | 57.3% | 108 | 42.7% | 1.09% | 0.48% | 0.23% | 1.85 |
| LGO | 29 | 35.4% | 53 | 64.6% | 82 | 158 | 62.5% | 95 | 37.5% | 2.80% | 0.72% | 0.52% | 2.12 |
| LH | 40 | 39.2% | 62 | 60.8% | 102 | 145 | 57.3% | 108 | 42.7% | 1.10% | 0.54% | 0.11% | 1.32 |
| LRC | 72 | 42.9% | 96 | 57.1% | 168 | 123 | 48.6% | 130 | 51.4% | 1.08% | 0.56% | 0.14% | 1.45 |
| LSU | 65 | 42.8% | 87 | 57.2% | 152 | 129 | 51.0% | 124 | 49.0% | 1.06% | 0.54% | 0.14% | 1.47 |
| LWB | 100 | 43.1% | 132 | 56.9% | 232 | 138 | 54.5% | 115 | 45.5% | 1.90% | 0.66% | 0.45% | 2.19 |
| M6B | 18 | 31.0% | 40 | 69.0% | 58 | 162 | 64.0% | 91 | 36.0% | 1.44% | 0.75% | -0.07% | 0.86 |
| M6E | 15 | 40.5% | 22 | 59.5% | 37 | 201 | 79.4% | 52 | 20.6% | 2.15% | 0.78% | 0.41% | 1.88 |
| MBT | 23 | 50.0% | 23 | 50.0% | 46 | 234 | 92.5% | 19 | 7.5% | 1.74% | 1.48% | 0.13% | 1.18 |
| MCL | 3 | 30.0% | 7 | 70.0% | 10 | 240 | 94.9% | 13 | 5.1% | 1.45% | 0.77% | -0.11% | 0.80 |
| MES | 131 | 64.2% | 73 | 35.8% | 204 | 179 | 70.8% | 74 | 29.2% | 1.79% | 0.70% | 0.90% | 4.61 |
| MGC | 31 | 33.3% | 62 | 66.7% | 93 | 168 | 66.4% | 85 | 33.6% | 1.09% | 0.51% | 0.02% | 1.06 |
| MHG | 3 | 60.0% | 2 | 40.0% | 5 | 247 | 97.6% | 6 | 2.4% | 0.21% | 0.66% | -0.14% | 0.48 |
| MNG | 0 | 0.0% | 0 | 0.0% | 0 | 253 | 100.0% | 0 | 0.0% | 0.00% | 0.00% | 0.00% | 100.00 |
| MNQ | 143 | 68.8% | 65 | 31.2% | 208 | 171 | 67.6% | 82 | 32.4% | 2.25% | 0.46% | 1.40% | 10.71 |
| MW | 49 | 43.8% | 63 | 56.2% | 112 | 139 | 54.9% | 114 | 45.1% | 1.22% | 0.54% | 0.23% | 1.76 |
| NBB | 23 | 39.7% | 35 | 60.3% | 58 | 158 | 62.5% | 95 | 37.5% | 5.00% | 1.08% | 1.33% | 3.05 |
| RS | 97 | 38.8% | 153 | 61.2% | 250 | 127 | 50.2% | 126 | 49.8% | 2.33% | 0.69% | 0.48% | 2.12 |
| SB2 | 22 | 37.3% | 37 | 62.7% | 59 | 143 | 56.5% | 110 | 43.5% | 2.92% | 0.71% | 0.64% | 2.44 |
| SEF | 19 | 52.8% | 17 | 47.2% | 36 | 211 | 83.4% | 42 | 16.6% | 5.32% | 1.14% | 2.27% | 5.20 |
| SJB | 50 | 44.2% | 63 | 55.8% | 113 | 152 | 60.1% | 101 | 39.9% | 0.79% | 0.55% | 0.04% | 1.13 |
| SM2 | 48 | 46.2% | 56 | 53.8% | 104 | 130 | 51.4% | 123 | 48.6% | 1.01% | 0.59% | 0.15% | 1.47 |
| TU | 12 | 31.6% | 26 | 68.4% | 38 | 172 | 68.0% | 81 | 32.0% | 5.84% | 0.93% | 1.21% | 2.90 |
| TY | 83 | 45.1% | 101 | 54.9% | 184 | 135 | 53.4% | 118 | 46.6% | 1.32% | 0.55% | 0.30% | 1.98 |
| US | 59 | 37.6% | 98 | 62.4% | 157 | 136 | 53.8% | 117 | 46.2% | 1.27% | 0.54% | 0.14% | 1.42 |
| XC2 | 27 | 36.5% | 47 | 63.5% | 74 | 156 | 61.7% | 97 | 38.3% | 1.65% | 0.78% | 0.11% | 1.21 |
| XS2 | 22 | 38.6% | 35 | 61.4% | 57 | 187 | 73.9% | 66 | 26.1% | 1.83% | 0.75% | 0.24% | 1.53 |
![]()
![]()
| Test Period for parameter run 1. | ||
| First Test Date | 2003-01-01 | |
| Last Test Date | 2024-01-29 | |
|
|
||||||||||||||||||||||||||||||||||||||||||||||||||||||||||||||||||||||||||||||||||||||||||||||||||||||||||||||||||||||||||||||||||||||||||||||||||||||||||||||||||||||||||||||||||||||||||||||||||||||||||||||||||||||||||||||||||||||||||||||||||||||||||||||||||||||||||||||||||||||||||||||||||||||||||||||||||||||||||||||||||||||||||||||||||||||||||||||||||||||||||||||
Required Disclaimer – Commodity Futures Trading Commission: Futures and options trading has large potential rewards, but also large potential risk. You must be aware of the risks and be willing to accept them in order to invest in the futures and options markets. Don’t trade with money you can’t afford to lose. This website is neither a solicitation nor an offer to Buy/Sell futures or options. No representation is being made that any account will or is likely to achieve profits or losses similar to those discussed on this website. The past performance of any trading system or methodology is not necessarily indicative of future results
CFTC RULE 4.41 – HYPOTHETICAL OR SIMULATED PERFORMANCE RESULTS HAVE CERTAIN LIMITATIONS. UNLIKE AN ACTUAL PERFORMANCE RECORD, SIMULATED RESULTS DO NOT REPRESENT ACTUAL TRADING. ALSO, SINCE THE TRADES HAVE NOT BEEN EXECUTED, THE RESULTS MAY HAVE UNDER-OR-OVER COMPENSATED FOR THE IMPACT, IF ANY, OF CERTAIN MARKET FACTORS, SUCH AS LACK OF LIQUIDITY, SIMULATED TRADING PROGRAMS IN GENERAL ARE ALSO SUBJECT TO THE FACT THAT THEY ARE DESIGNED WITH THE BENEFIT OF HINDSIGHT. NO REPRESENTATION IS BEING MADE THAT ANY ACCOUNT WILL OR IS LIKELY TO ACHIEVE PROFIT OR LOSSES SIMILAR TO THOSE SHOWN.