Global Diversification: The Free Exotic Lunch
Read on for our test results – using our State of Trend Following systems – on how global diversification can boost trading performance, compared to a more standard diversification approach.
Portfolios can be customized to various account sizes, risk, and markets traded.
Is classic diversification enough?
Global vs Classic Diversification: Exotic Markets Impact Test
- “Standard” portfolio – using “classic” diversification
- Global diversified portfolio – including some exotic markets
- Remote/“exotic” exchanges or products (South African exchange or Brazilian Real)
- Alternative markets to the mainstream ones (Corn on the MATIF instead of the CME)
- Niche markets (like Milk or Lumber)
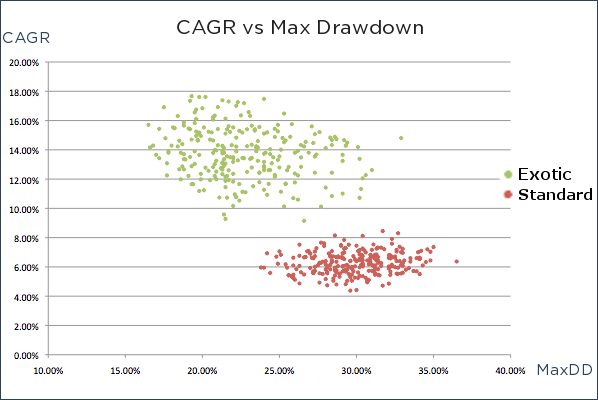
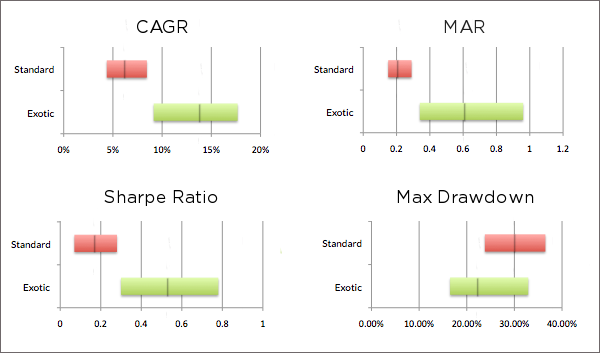
How Exotic Portfolios Out-Perform Standard Ones: The Test Results

CAGR |
Average | Min | Max |
|---|---|---|---|
| Standard | 6.26% | 4.38% | 8.45% |
| Exotic | 13.8% | 9.15% | 17.67% |
MAR |
Average | Min | Max |
|---|---|---|---|
| Standard | 0.21 | 0.15 | 0.29 |
| Exotic | 0.61 | 0.34 | 0.99 |
Sharpe |
Average | Min | Max |
|---|---|---|---|
| Standard | 0.17 | 0.07 | 0.28 |
| Exotic | 0.53 | 0.3 | 0.78 |
MaxDD |
Average | Min | Max |
|---|---|---|---|
| Standard | 29.90% | 23.80% | 36.50% |
| Exotic | 22.20% | 16.50% | 32.90% |

Test Details
The systems (and system allocation) used in the test are identical to those used for the Wisdom State of Trend Following.
A large list of markets were then selected and classified as exotic or standard, as well as by sector. These markets were then fed to the random portfolio generator, constrained with specific numbers of instruments per sector – to make the portfolios relevant for comparison, in the context of diversification:
| Sector | Standard | Exotic? |
|---|---|---|
| Currencies | 4 | 2+2* |
| Energies | 2 | 1+1* |
| Equity Indices | 4 | 2+2* |
| Grains | 4 | 2+2* |
| Long Rates | 3 | 1+2* |
| Meats | 2 | 2+0* |
| Metals | 3 | 1+2* |
| Short Rates | 2 | 1+1* |
| Softs | 3 | 1+2* |
The “starred” number is the number of exotic markets. For example, the metals sector always contains 3 different markets and in the case of exotic portfolios, 2 of these markets are exotic, with the remaining 1 being standard.
| Currencies | Exchange | Exotic? |
|---|---|---|
| Australian Dollar | CME | N |
| British Pound | CME | N |
| Canadian Dollar | CME | N |
| Euro | CME | N |
| Japanese Yen | CME | N |
| US Dollar Index | ICE | N |
| Brazilian Real | CME | Y |
| Euro / Japanese Yen | CME | Y |
| Indian Rupee | CME | Y |
| Korean Won | KRX (Kofex) | Y |
| New Zealand Dollar | CME | Y |
| Energies | Exchange | Exotic? |
|---|---|---|
| Gasoline (RBOB) | NYMEX | N |
| Light Sweet Crude Oil (WTI) E-mini | NYMEX | N |
| Natural Gas (Henry Hub) E-mini | NYMEX | N |
| Brent Crude Oil | ICE EUR (IPE) | Y |
| Gas Oil | ICE EUR (IPE) | Y |
| Gas Oil | TOCOM | Y |
| Gasoline | TOCOM | Y |
| Kerosene | TOCOM | Y |
| Metals | Exchange | Exotic? |
|---|---|---|
| Copper | CME (NYMEX) | N |
| Gold | CME (COMEX) | N |
| Palladium | CME (NYMEX) | N |
| Silver | CME (COMEX) | N |
| Gold | TOCOM | Y |
| Palladium | TOCOM | Y |
| Silver | TOCOM | Y |
| Meats | Exchange | Exotic? |
|---|---|---|
| Cattle Feeder | CME | N |
| Live Cattle | CME | N |
| Short Rates | Exchange | Exotic? |
|---|---|---|
| Euribor 3-month | EURONEXT (LIFFE) | N |
| Fed Funds | CME (CBOT) | N |
| 90-Day NZ Bank Bills | ASX (SFE-NZFE) | Y |
| Australian Bank Bills (90 day) | ASX (SFE) | Y |
| Equity Indices | Exchange | Exotic? |
|---|---|---|
| Dax index | EUREX | N |
| Dow Jones | CME | N |
| Mini Russell 1000 index | ICE US (NYFE) | N |
| Nasdaq 100 | CME | N |
| S&P 500 | CME | N |
| FTSE Xinhua China A50 index | SGX | Y |
| Hang Seng index mini | HKEx | Y |
| MSCI Singapore Stock index | SGX | Y |
| TOPIX index | TSE | Y |
| Grains | Exchange | Exotic? |
|---|---|---|
| Corn | CME (CBOT) | N |
| Oats | CME (CBOT) | N |
| Rice Rough | CME (CBOT) | N |
| Soybeans | CME (CBOT) | N |
| Wheat | KCBT | N |
| Wheat | CME (CBOT) | N |
| Azuki Beans | TOCOM | Y |
| Corn | NYSE Liffe (MATIF) | Y |
| Crude Palm Oil | BMD (MDEX) | Y |
| Milling Wheat | EURONEXT (MATIF) | Y |
| Rapeseed | NYSE Liffe (MATIF) | Y |
| Yellow Maize | SAFEX | Y |
| Long Rates | Exchange | Exotic? |
|---|---|---|
| Euro German Bund | EUREX | N |
| Japanese 10-Year Govt Bond | SGX | N |
| U.S. T-Bonds-30 Yr. | CME (CBOT) | N |
| US T-Notes 5-Year | CME (CBOT) | N |
| Australian Govt Bond | ASX (SFE) | Y |
| Canadian 10-Year Govt Bond | MX | Y |
| Swiss 10-Year Govt Bond | EUREX | Y |
| Softs | Exchange | Exotic? |
|---|---|---|
| Cocoa | ICE US (NYBOT-CSCE) | N |
| Coffee | ICE US (NYBOT-CSCE) | N |
| Cotton (#2) | ICE US (NYBOT-NYCE) | N |
| Robusta Coffee | NYSE Liffe (LIFFE) | Y |
| Sugar (#11) | ICE US (NYBOT-CSCE) | N |
| Cocoa | NYSE Liffe (LIFFE) | Y |
| Lumber | CME | Y |
| Milk (Class III) | CME | Y |
| Rubber | TOCOM | Y |
Boost your trading opportunities: Access more Exotic Markets
At Wisdom Trading, we strive to take your trading further. One way we do this is by expanding the frontiers of your trading universe. We offer one of the widest product offerings in the industry with access to over 300 markets on 30+ global exchanges.
Take your trading truly global: get in touch today to discuss how exotic diversification can boost your trading performance. We’ll be happy to discuss portfolio selection and recommended trading capital, specific markets coverage, or more specific system performance over different globally diversified portfolios.
Disclaimer
Leave a Reply
You must be logged in to post a comment.
